MARKET OVERVIEW IN 2023
INTERNATIONAL MARKET

The global fertilizer market in 2023 was significantly impacted by geopolitical turmoil and export restrictions in certain countries, leading to a rapid decline in fertilizer prices compared to 2022. Ongoing conflicts such as Russia-Ukraine and Israel-Hamas raised concerns about potential escalation in the Middle East, a major fertilizer production region. Following record-high prices in 2022, fertilizer prices plummeted from the fourth quarter of 2023, with Urea prices dropping by approximately 64% and Potash prices by 67%.
DOMESTIC MARKET
In 2023, the domestic fertilizer market faced significant adverse impacts:
In conclusion, given these circumstances, the production and business outcomes of fertilizer enterprises in the market witnessed substantial declines compared to the corresponding period.
PVFCCo VALUE CHAIN
PRODUCTION AND BUSINESS OPERATIONS
OUTSTANDING FACTORS AND TARGETS IN PRODUCTION AND BUSINESS OPERATIONS IN 2023
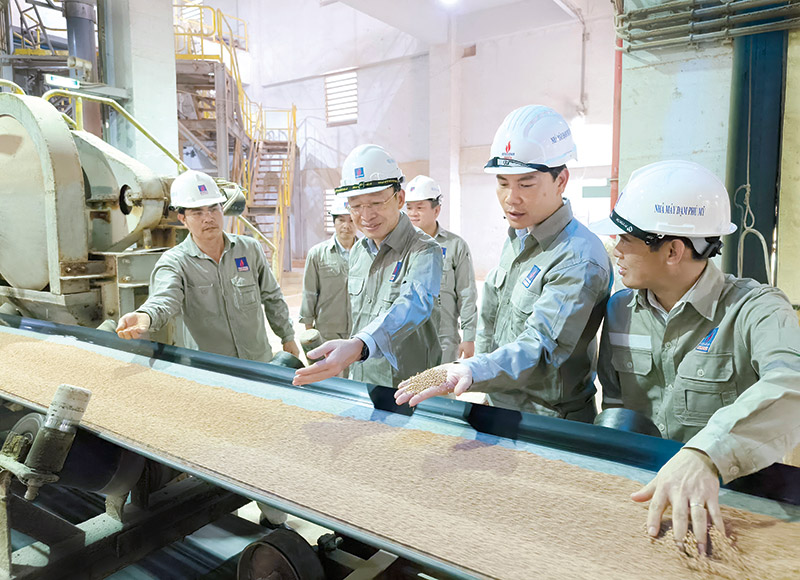
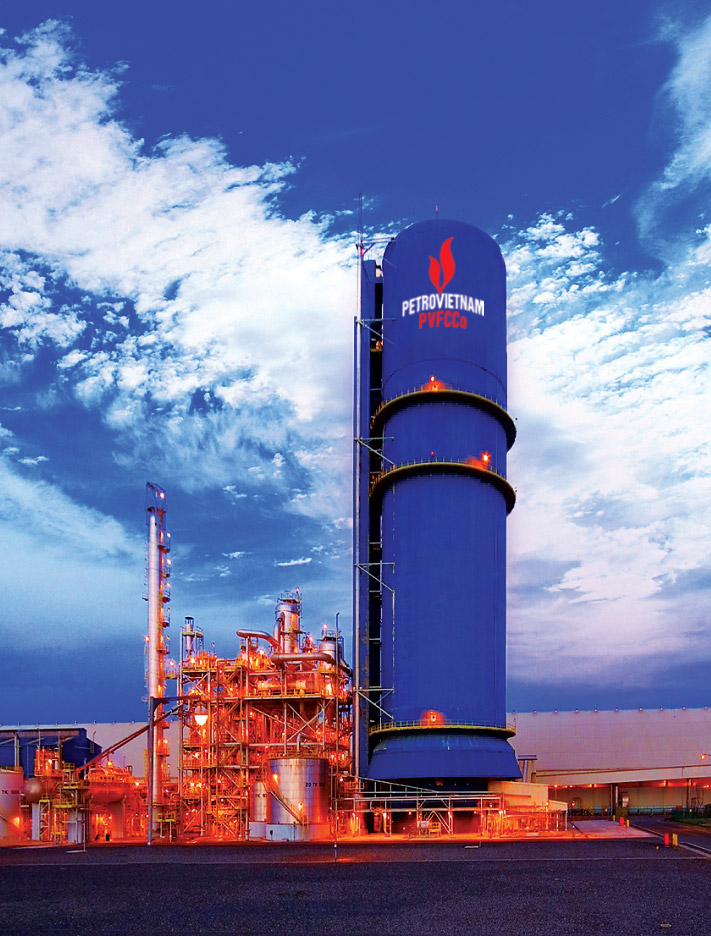
Against the backdrop of 2023, PVFCCo persisted in capitalizing on various advantageous factors. These included the esteemed reputation of the Phu My fertilizer brand and the expansive geographical reach of its distribution network. Operations at the Phu My Fertilizer Plant remained steadfastly stable, operating at high capacity levels with ample gas supply. Financial health remained robust, bolstering both production and business endeavors, thereby attaining a range of notable performance targets:
SUMMARY ON BUSINESS PERFORMANCE IN 2023
| No. | Item | Unit | Actual 2022 | Plan 2023 | Actual 2023 | Ratio compared with 2022 (% ) | Plan completion rate (%) |
|---|---|---|---|---|---|---|---|
| A | B | C | 1 | 2 | 3 | 4=3/1 | 5=3/2 |
| I | Production output | ||||||
| 1.1 | Phu My Urea | Thousand tons | 917 | 785 | 816 | 89% | 104% |
| 1.2 | UFC 85 | Thousand tons | 13.2 | 12.0 | 12.2 | 92% | 102% |
| 1.3 | NPK | Thousand tons | 155 | 121 | 120 | 77% | 100% |
| 1.4 | Phu My Urea + KeBo | Thousand tons | 4.5 | 6.9 | 7.0 | 155% | 101% |
| 1.5 | NH3 (for trading) | Thousand tons | 74 | 55 | 55 | 73% | 100% |
| II | Sales volume | ||||||
| 2.1 | Phu My Urea | Thousand tons | 791 | 830 | 879 | 111% | 106% |
| 2.2 | NPK | Thousand tons | 129 | 130 | 138 | 107% | 106% |
| 2.3 | Phu My Urea + KeBo | Thousand tons | 2.6 | 7.0 | 7.9 | 299% | 113% |
| 2.4 | Other fertilizers | Thousand tons | 209 | 240 | 266 | 127% | 111% |
| 2.5 | UFC 85 | Thousand tons | 9.5 | 8.5 | 9.1 | 95% | 107% |
| 2.6 | NH3 (for trading) | Thousand tons | 71 | 62 | 64 | 89% | 102% |
| 2.7 | CO2 | Thousand tons | 54 | 39 | 44 | 82% | 111% |
| 2.8 | Chemicals | Thousand tons | 1.03 | 0.67 | 1.54 | 149% | 231% |
| III | Consolidated financial indicators | ||||||
| 3.1 | Total revenue | VND billion | 19,013 | 13,067 | 14,038 | 74% | 107% |
| 3.2 | Profit before tax | VND billion | 6,606 | 610 | 691 | 10% | 113% |
| 3.3 | Profit after tax | VND billion | 5,585 | 463 | 530 | 9% | 114% |
| 3.4 | Budget payable (paid) | VND billion | 1,614 | 240 | 565 | 35% | 235% |
| IV | Parent company’s financial indicators | ||||||
| 4.1 | Owner’s equity | VND billion | 13,779 | 10,149 | 11,374 | 83% | 112% |
| 4.2 | In which: Charter capital | VND billion | 3,914 | 3,914 | 3,914 | 100% | 100% |
| 4.3 | Total revenue | VND billion | 16,924 | 11,652 | 12,093 | 71% | 104% |
| 4.4 | Profit before tax | VND billion | 6,507 | 635 | 709 | 11% | 112% |
| 4.5 | Profit after tax | VND billion | 5.511 | 495 | 569 | 10% | 115% |
| 4.6 | Ratio of Profit after tax/ Charter capital | % | 141% | 13% | 15% | 10% | 115% |
| 4.7 | Budget payable (paid) | VND billion | 1,551 | 205 | 503 | 32% | 245% |
| 4.8 | Investment | ||||||
| 4.8.1 | Investment disbursement | VND billion | 118.14 | 220.6 | 219.74 | 186% | 100% |
| Capex | VND billion | 74.70 | 102.9 | 102.45 | 137% | 100% | |
| Equipment procurement | VND billion | 43.44 | 117.7 | 117.29 | 270% | 100% | |
| Capital investment | VND billion | ||||||
| 4.8.2 | Capital investment source | VND billion | 118.14 | 220.6 | 219.74 | 186% | 100% |
| Owner’s equity | VND billion | 118.14 | 220.6 | 219.74 | 186% | 100% | |
| Loans and others | VND billion | ||||||
Production and business statistics for the Corporation’s leading products over 2014-2023 period
Production and sales targets (thousand tons)
- Urea Production
- Urea Consumption
- NPK Production
- NPK Consumption
Consolidated financial indicators (VND billion)
- Revenue
- Profit before tax
- Profit after tax
INVESTMENT IN AND IMPLEMENTATION OF PROJECTS
INVESTMENT PROJECTS PLANNED IN 2023

- The NH3 Revamp - Phu My NPK Complex: The Corporation has completed project settlement report and verification and approval on capital settlement.
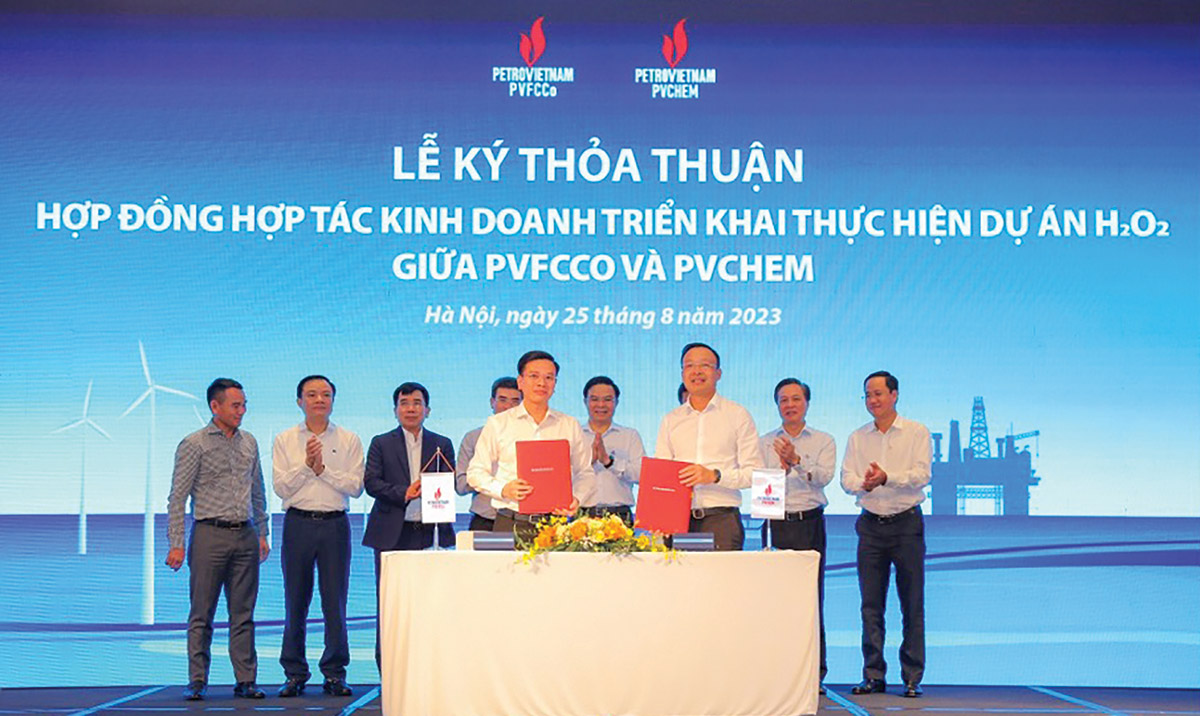
- Hydrogen Peroxide (H2O2) Plant:: Already completed feasibility study report (FS), submitted for FS verification, hired FS verification consultant and submitted to the relevant State authorities.
- Offgas recovery project: Already completed and approved feasibility study report.
- Melamine project: Already completed feasibility study report.
- DEF/Adblue project: Completing feasibility study report.
- Soda Ash project: Completed feasibility study report. The project was assessed as ineffective and the BOD decided to stop further investment research.
- Project for warehouse of 20 thousand tons of finished goods at Phu My Fertilizer Plant: The project was completed and put into service on 21 June 2023 and is under the process of completing capital settlement.
- Other investment and procurement projects are being implemented as planned.
INVESTMENT AND PROCUREMENT DISBURSEMENT SITUATION IN 2023
According to the 2023 plan, total capital for investment in construction and procurement was VND 220.58 billion. PVFCCo disbursed over VND 219.74 billion, achieving nearly 100% of the plan according to the actual progress, an increase of 84% compared to 2022.
PERFORMANCE OF SUBSIDIARIES AND DEPENDENT UNITS
| No. | Contents | Equity to total charter capital ratio | Total invested capital (VND billion) |
Charter capital (VND billion) |
Profit after tax (PAT) (VND billion) |
PAT to charter capital ratio | 2023 dividend (VND billion) |
|---|---|---|---|---|---|---|---|
| I | Investment in subsidiaries | 386.25 | 515.00 | 41.39 | 44.78 | ||
| 1 | PVFCCo North | 75.00% | 90.00 | 120.00 | 6.32 | 5.27% | 10.8 |
| 2 | PVFCCo Central | 75.00% | 75.00 | 100.00 | 20.94 | 20.94% | 225 |
| 3 | PVFCCo SE | 75.00% | 93.75 | 125.00 | 12.07 | 9.66% | |
| 4 | PVFCCo SW | 75.00% | 127.50 | 170.00 | 2.06 | 1.21% | 11.48 |
| II | Investment in joint venture companies | 680.90 | 2,487.80 | 849.48 | 2.18 | ||
| 1 | VNPOLY | 25.99% | 562.70 | 2,165.11 | 850.41 | 39.28% | |
| 2 | PVC Mekong | 35.63% | 100.00 | 280.69 | -8.16 | -2.91% | - |
| 3 | PVFCCo Packaging | 43.34% | 18.20 | 42.00 | 7.23 | 17.21% | 2.18 |
| III | Other long-term investments | 20.50 | 396.35 | -9.2 | 0.29 | ||
| 1 | PAIC | 8.50% | 3.60 | 42.35 | 4.82 | 11.38% | 0.29 |
| 2 | Ut Xi Aquatic Products Processing Corporation | 6.78% | 16.90 | 354.00 | -14.02 | -3.96% | |
| TOTAL | 1,087.65 | 3,399.15 | 881.67 | 57.94 |
THE CORPORATION'S FINANCIAL PERFORMANCE
FINANCIAL PERFORMANCE
Unit: VND billion
| Item | 31/12/2022 | 31/12/2023 | % Increase (Decrease) |
|---|---|---|---|
| TOTAL ASSETS | 17,699 | 13,309 | -25% |
| Current assets | 13,579 | 9,565 | -30% |
| Non-current asset | 4,120 | 3,744 | -9% |
| TOTAL RESOURCES | 17,699 | 13,309 | -25% |
| LIABILITIES | 3,681 | 1,764 | -52% |
| OWNER’S EQUITY | 14,017 | 11,545 | -18% |
Charter capital |
3,914 | 3,914 | 0% |
| TOTAL REVENUE | 19,013 | 14,038 | -26% |
| TOTAL COST | 12,410 | 13,349 | 8% |
| INTEREST | 65 | 51 | -22% |
| EBIT | 6,668 | 739 | -89% |
| PROFIT BEFORE TAX | 6,606 | 691 | -90% |
| PROFIT AFTER TAX | 5,585 | 530 | -91% |
Profit after tax of minority shareholders |
20 | 10 | |
Profit after tax of parent company |
5,565 | 519 |
FINANCIAL INDICATORS
| Item | 2022 | 2023 |
|---|---|---|
| Liquidity ratios | ||
| Current ratio | 4.53 | 6.44 |
| Quick ratio | 3.24 | 5.16 |
| Solvency ratios | ||
| Total debt/total assets | 21% | 13% |
| Total debt/total equity | 26% | 15% |
| Operational capacity ratios | ||
| Inventory turnover | 3.25 | 4.12 |
| Net revenue/total assets | 1.18 | 0.88 |
| Profitability ratios | ||
| Net profit after tax/Net revenue | 30.0% | 3.9% |
| ROE | 45.2% | 4.1% |
| ROA | 35.3% | 3.4% |
| EPS | 13,897 | 1,030 |
BOM’S ASSESSMENT REPORT
ASSESSMENT ON PERFORMANCE
In the actual situation and conditions of production and business activities in 2023 as reviewed and evaluated above, on the basis of the tasks and targets of the annual plan approved by the General Meeting of Shareholders, PVFCCo’s Board of Management evaluated the implementation of timely, synchronous and flexible solutions, helping the Corporation achieve business results in 2023 for each specific field as follows:
Limitations and solutions, details as follows:
FINANCIAL ANALYSIS
Assets and Capital
Total assets according to PVFCCo’s consolidated financial statements as of 31 December 2023 were VND 13,309 billion, a decrease of 25% compared to the beginning of the year (13,309/17,699). PVFCCo’s cash and cash equivalents decreased by 40% compared to the beginning of the year (VND 1,242/2,084 billion). This reduction is primarily attributed to the Corporation’s cash dividend payout for the year 2022 (at a rate of 70% of the par value of shares, equivalent to VND 2,739 billion).

Liabilities
- PVFCCo’s liabilities as of 31/12/2023 were VND 1,764 billion, a decrease of 52% compared to the beginning of the year (VND 1,764/3,681 billion).
- Total liability to total assets ratio and total liability to equity ratio decreased compared to those of 2022, but the current ratio and quick ratio in 2023 remained higher than 1. This demonstrates a good capacity to pay debts, and the Corporation is not under any pressure on due debt, ensuring good production and business activities.
- Given the closing balance of Cash and Cash equivalents of VND 1,242 billion, there is sufficient funding for manufacturing, trading and investment projects as planned.
Profitability
PVFCCo’s profitability ratios such as ROE and ROA drastically decreased compared to the same period mainly due the decrease in 2023 profit after tax, by 90% from 2022, leading to the decrease in ROE and ROA.
IMPROVEMENTS IN ORGANIZATIONAL STRUCTURE, POLICIES, AND MANAGEMENT
The Corporation has developed and executed a restructuring plan and roadmap for the 2021-2025 period. This includes ongoing review, adjustment, and updating of department/unit functions and tasks. Additionally, efforts are underway to enhance internal regulations, risk management, and salary policies, while accelerating the digital transformation journey.
DEVELOPMENT PLAN FOR THE FUTURE
Board of Management is executing strategic development plans, including mid-term production and business plans approved by General Meeting of Shareholders and Board of Directors.
MAKING ASSESSMENTS ON ENVIRONMENTAL, STAFF AND SOCIAL RESPONSIBILITIES
Details of the assessment on environmental, staff and social responsibilities are presented in Chapter 5 – Sustainable Development Report pages 80-105.
